publications
We see more and farther than our predecessors, not because we have keener vision or greater height, but because we are lifted up and borne aloft on their gigantic stature.
2024
- Pedestrian and Car Occupant Crash Casualties Over a 9-Year Span of Vision Zero in New York CityTransportation research record, Jul 2024
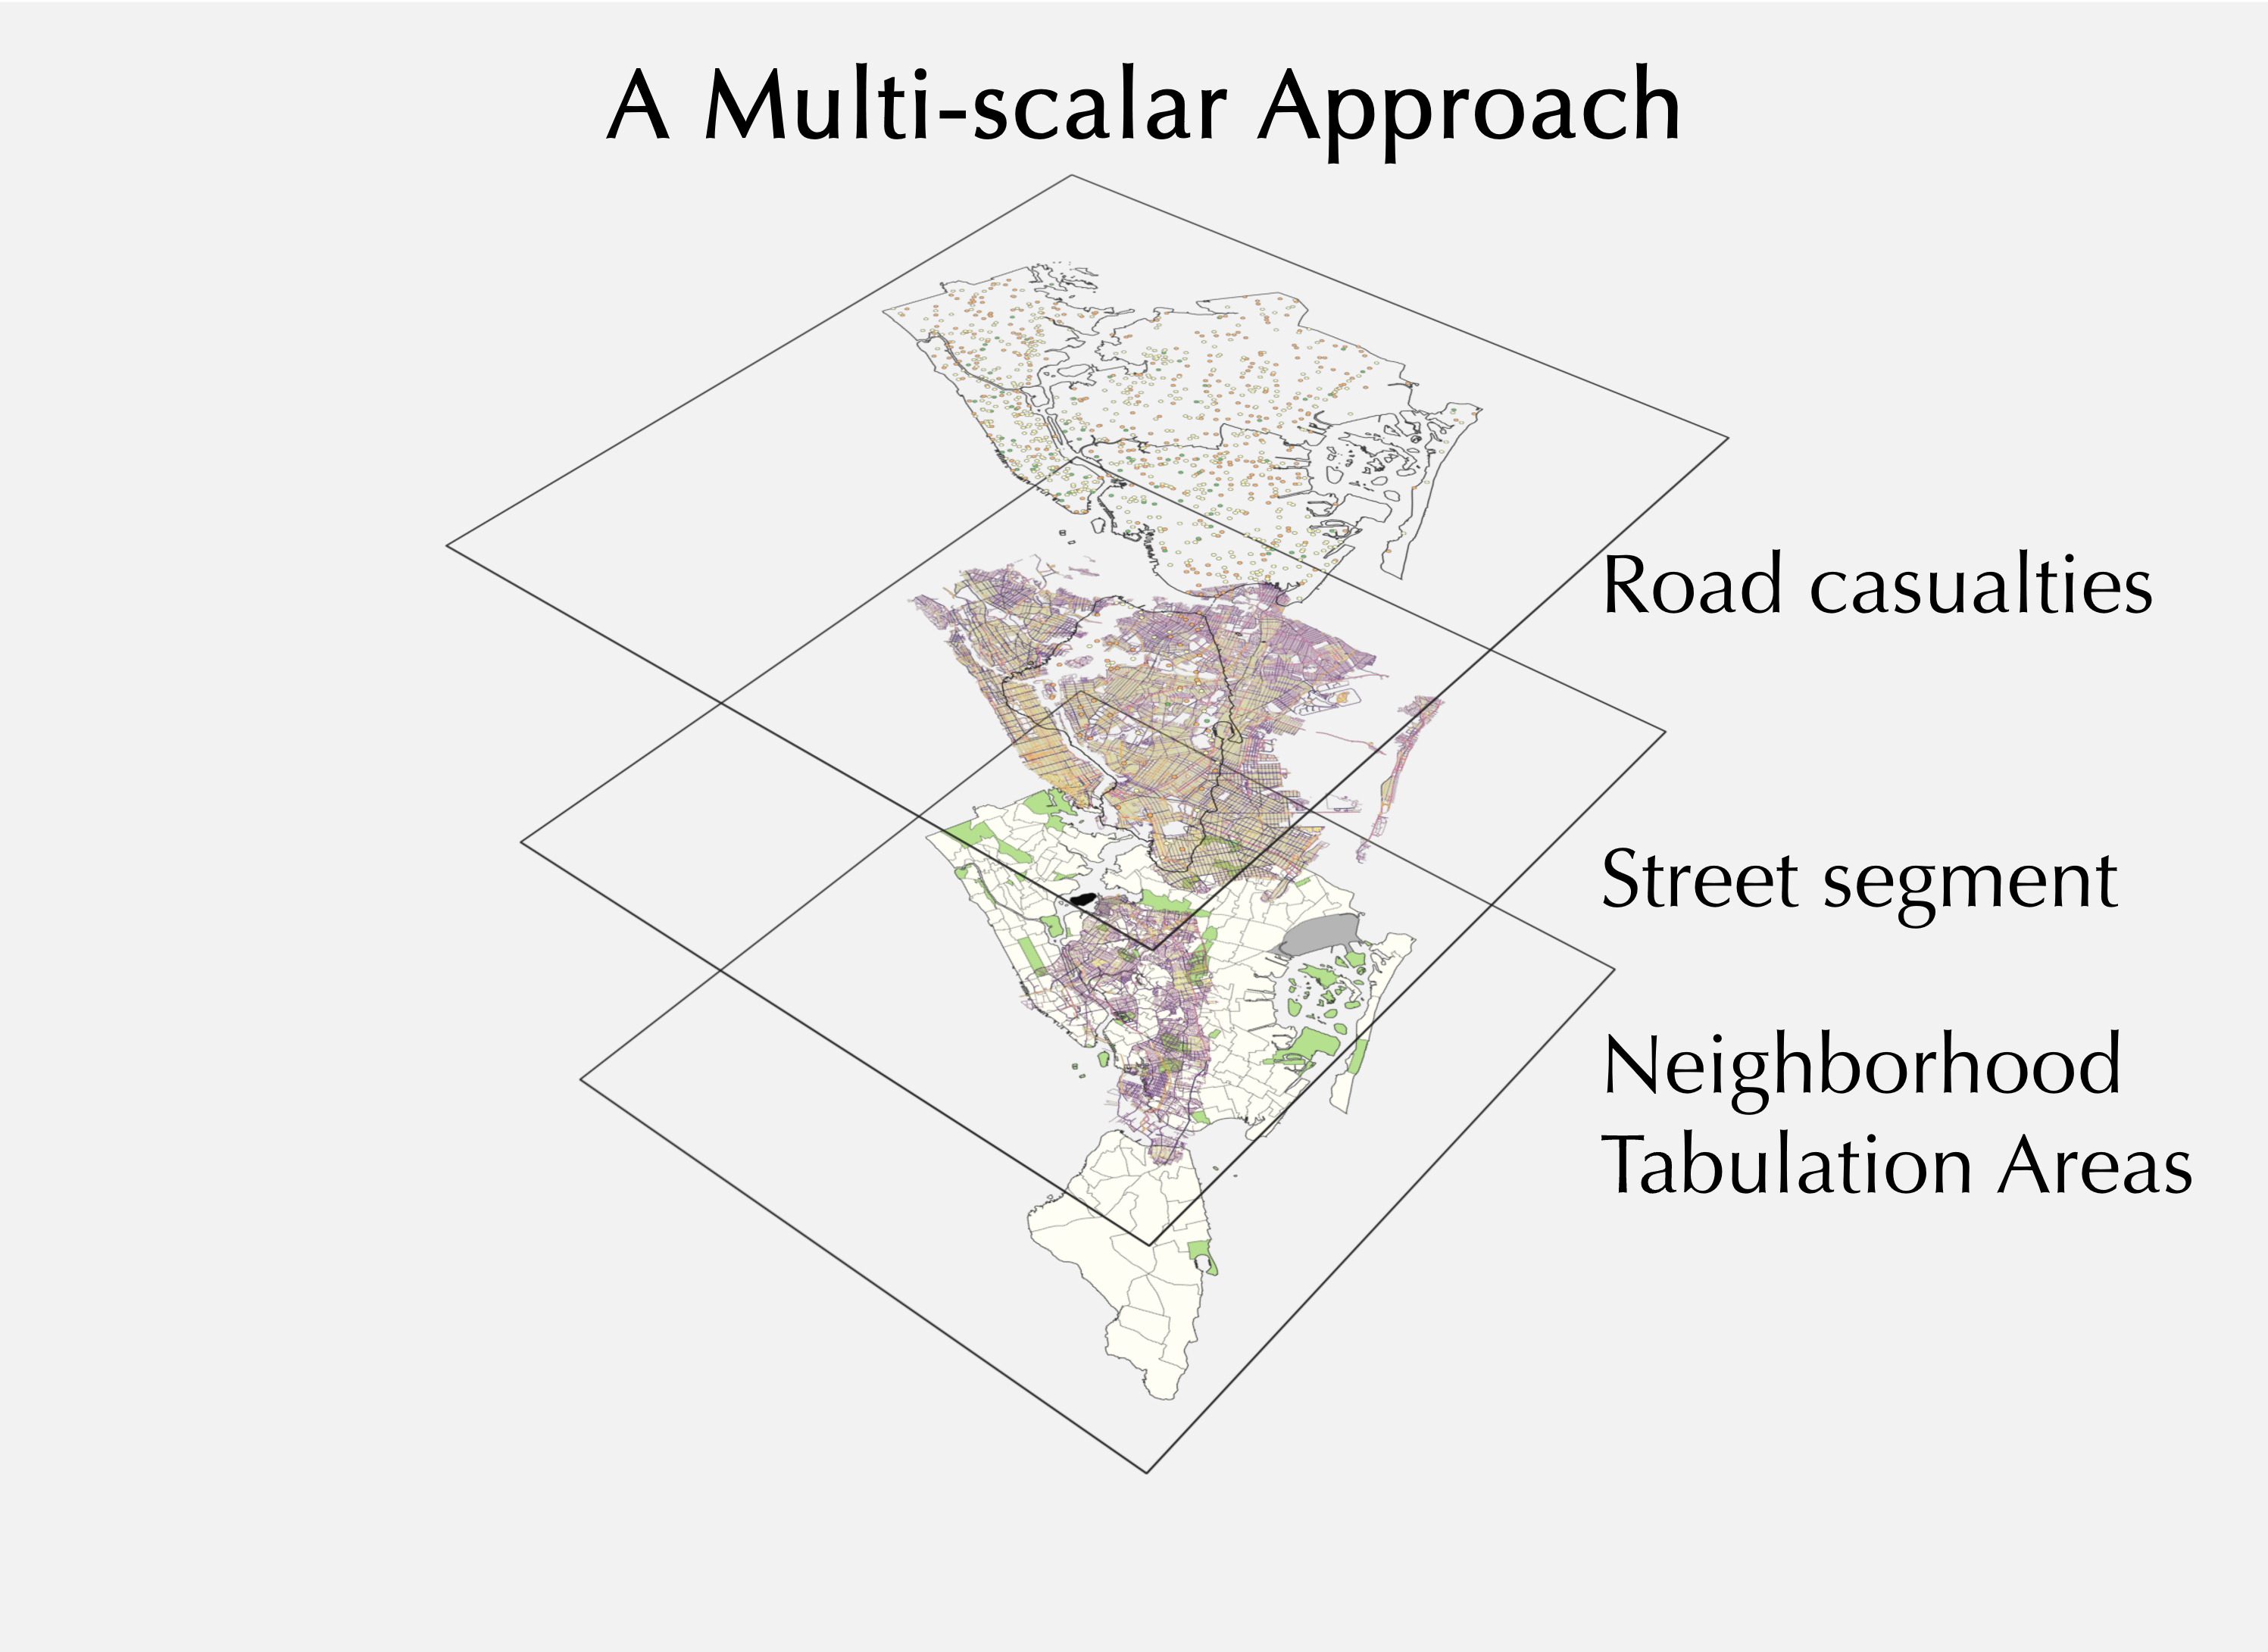
Vision Zero has been increasingly embraced by jurisdictions across the United States. Existing research primarily focuses on the theoretical principles and effectiveness of specific engineering measures. However, there is limited understanding of the holistic effects of Vision Zero treatments, in the context of street type and urban environment. We developed a street typology framework to categorize street segments using four design and operational features: street width, traffic direction (one- versus two-way), number of travel lanes, and presence of on-street parking. We applied a sample-based partitioning around medoids algorithm to classify 90,327 street segments in New York City. This process results in six distinctive types of street segment. To integrate neighborhood-level factors (e.g., land use variables and sociodemographics), we aggregated street segments of a given street type for each neighborhood. Negative binomial regression models were developed for pedestrian and car occupant crash injuries and fatalities separately for three periods: 2014 to 2016, 2017 to 2019, and 2020 to 2022. Our findings showed that street-segment groups with narrower, two-way sections and greater tree canopy coverage were significantly associated with a lower risk of casualties for both pedestrians and motorized users. Street-segment groups located in neighborhoods with a larger percentage of African American and Hispanic American residents experienced a significantly greater risk of casualties. Vision Zero treatments had mixed effects on safety outcomes. Streets treated with leading pedestrian intervals showed a lower risk of casualties. Neighborhood- and arterial slow zones were associated with a lower risk of car occupant casualties.
2023
- Moving beyond the Vision Zero sloganGe Shi, Vannesa Methoxha, Carol Atkinson-Palombo, and Norman GarrickTransportation research record, Mar 2023
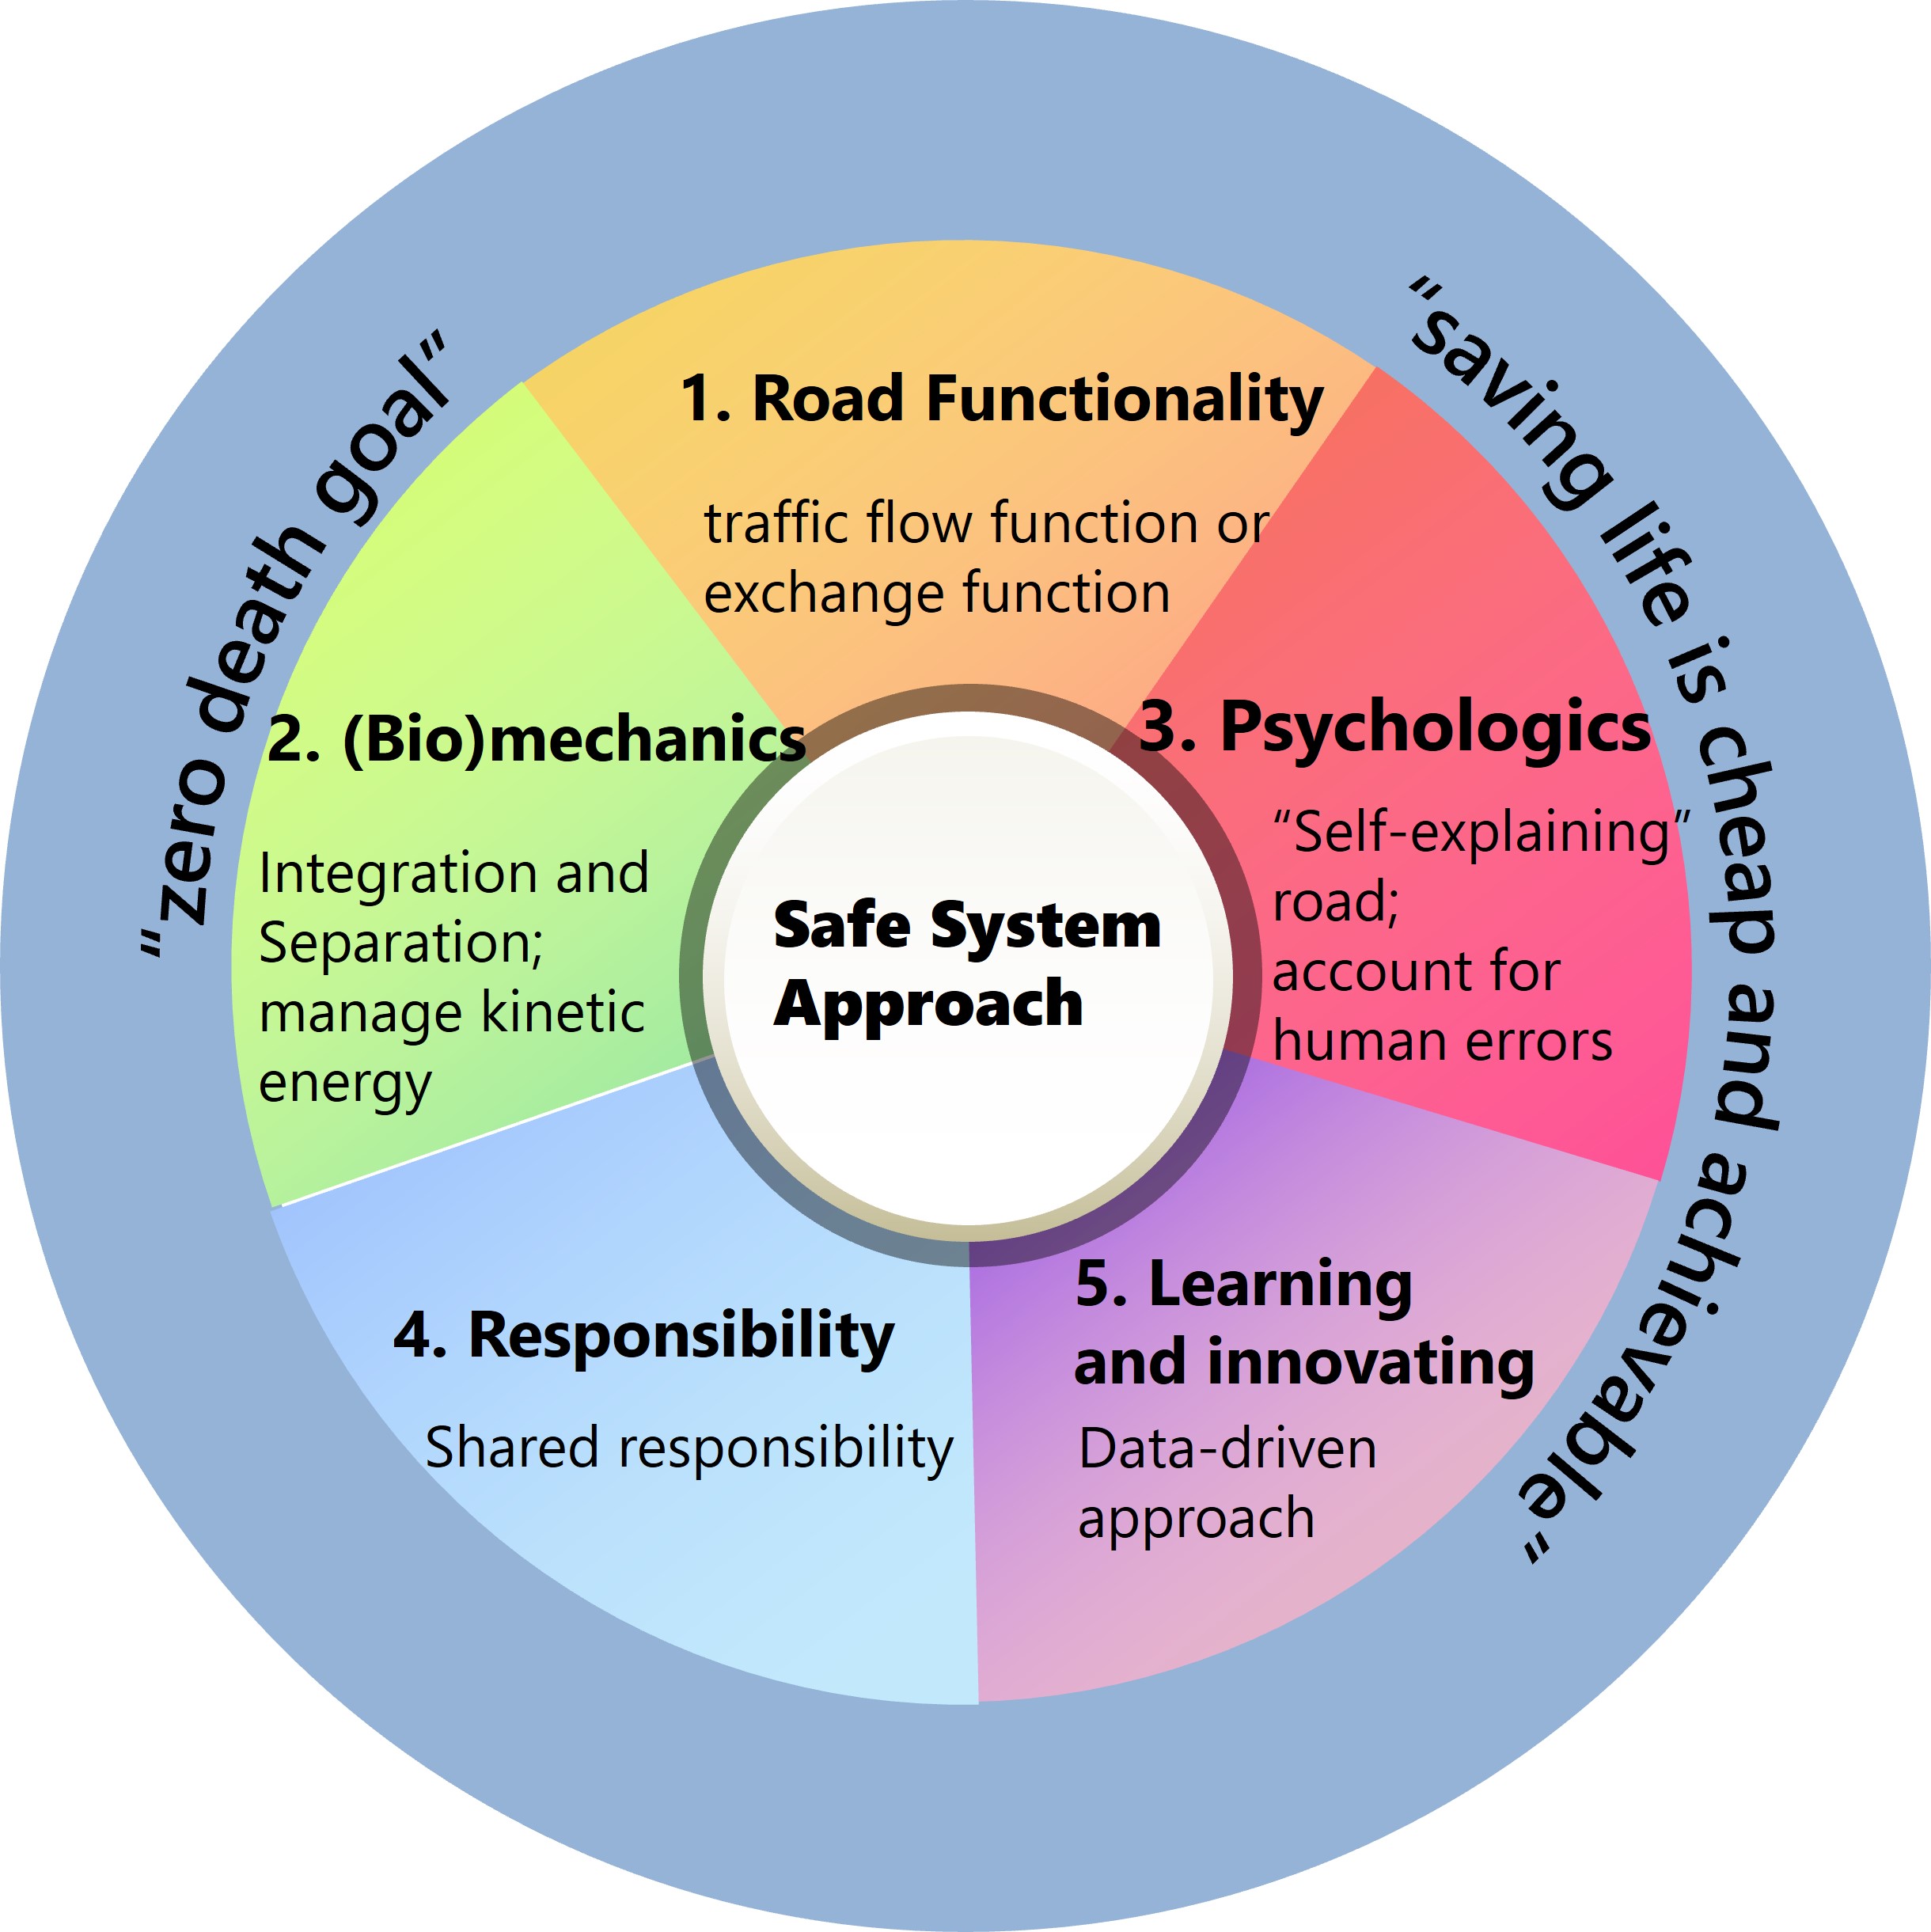
Safe System is a holistic way of managing traffic safety based on all components within that system including road environments, speed regimes, vehicle safety, and post-crash intervention. The ultimate goal is to achieve zero road death and serious injury. Safe System was pioneered in the Netherlands and Sweden in the 1990s and gradually began to influence traffic safety management in other countries, including the U.S. Our research shows that since the adoption of Safe System in the Netherlands and Sweden, the risk of fatality has decreased at a rate far outpacing that in the U.S. The improvements have been particularly impressive when it comes to pedestrians and bicyclists who now have fatality risks that are as low as that of people in cars. Our paper outlines details of the Dutch and Swedish approach to Safe System that is associated with their tremendous success in reducing traffic fatality. The synthesis suggests that to embrace the Safe System approach, we need a paradigm shift that puts safety and quality of life at the forefront of our thinking about transportation planning, design, and implementation. We argue that there is a need for a broader dissemination, understanding, and adoption of the underlying principles of Sustainable Safety, and recommend that universities improve engineering and planning education with more Sustainable Safety thinking. We also argue for greater coordination between federal, state, and municipal agencies, and a move away from victim blaming toward the achievable goal of zero road deaths through the adoption of Sustainable Safety approaches.
- Road Safety in New York City After Vision Zero for Different Land Use ContextsIn Transportation Research Board 102nd Annual Meeting, Jan 2023
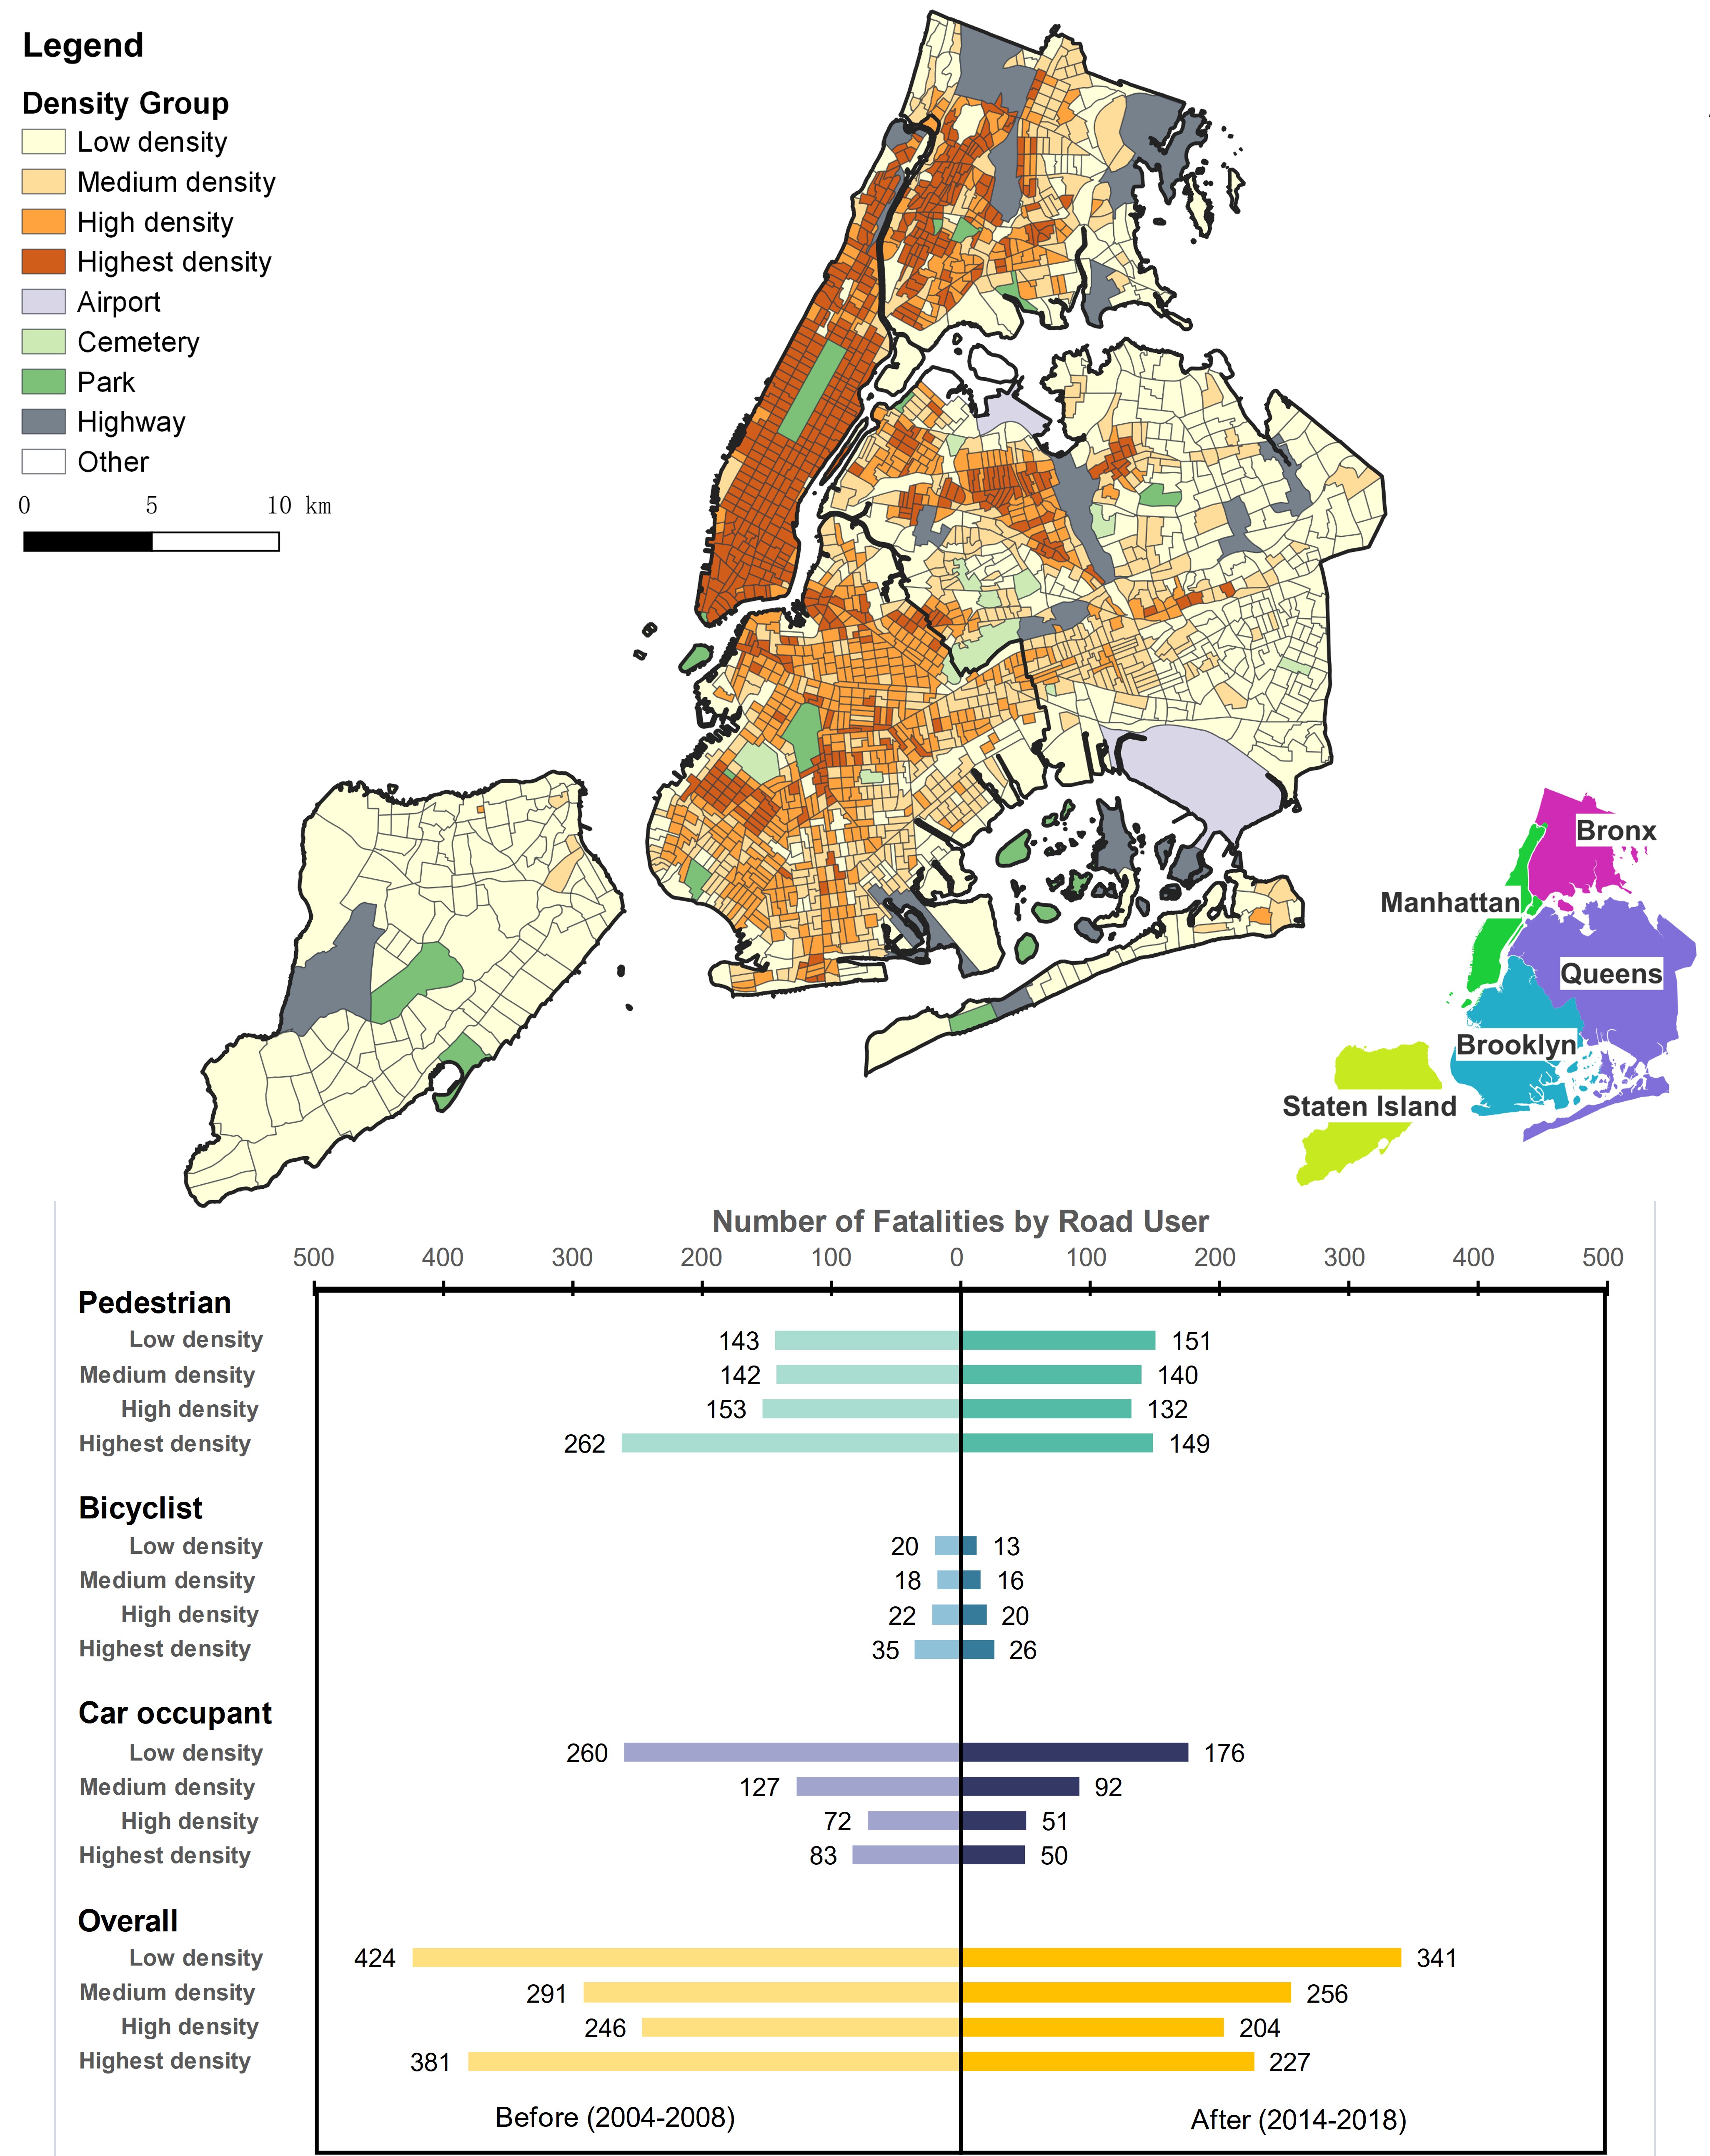
Over the past decade, more than 45 cities have committed to Vision Zero in the United States. New York City is one of them that has made good progress in reducing car occupant fatalities but struggled to achieve similar declines in pedestrian and bicyclist fatalities. This study assesses road safety performance based on land use context at the census tract level. We use the combined density of population and jobs to categorize NYC census tracts and compare fatalities and fatality risk for different classes of road users in each group. Using aggregate crash data for 2004-2008 and 2014-2018, we track the changes before and after launch of Vison Zero in 2014. We identify a large and growing discrepancy in fatality rates between pedestrians, bicyclists, and car occupants at places with different land use features. Surprisingly, the low density group has the largest number of pedestrian fatalities compared to other density groups in 2014-2018. This is unexpected since low density areas are places where one would not expect to see large numbers of pedestrians. Fatalities per 1,000 road users and fatality risk for pedestrians and bicyclists decreased with the density of the land use. There were very little or no declines in pedestrian and bicyclist fatalities from before to after Vision Zero, expect in the highest density areas. It suggests the need for cities to better understand the relationship between land use context and traffic safety and to implement context appropriate strategies to effectively address traffic fatality issue.
2021
- Sustainable safety in the Netherlands creating a road environment where people on foot and on bikes are as safe as people in carsGe Shi, Vannesa Methoxha, Carol Atkinson-Palombo, and Norman GarrickTransportation research record, Nov 2021
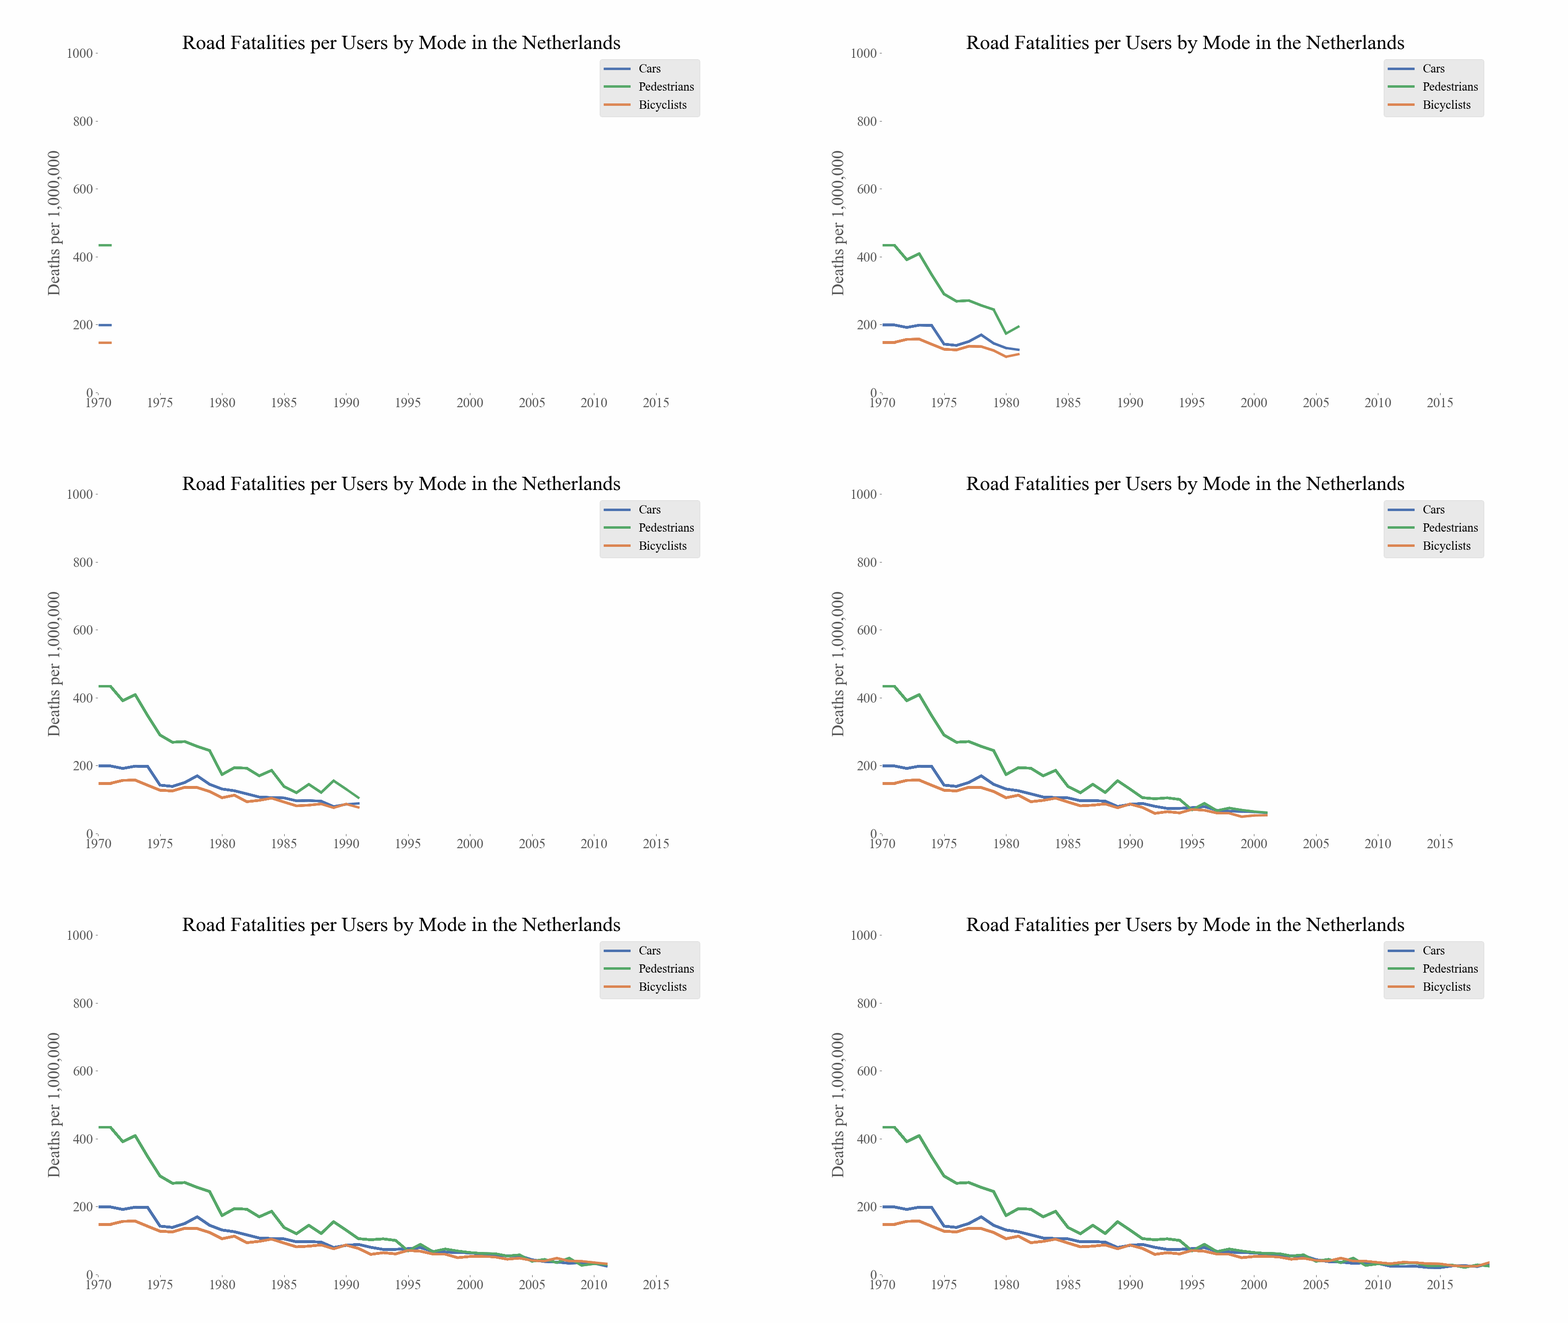
Road crashes claim over one million lives each year worldwide, overwhelmingly in low- and middle-income countries. A handful of higher-income countries have made great progress in reducing traffic fatalities and are moving toward Vision Zero. The goal of this study is to evaluate how one such country, the Netherlands, has cut its traffic fatalities by over 90%. The results show that the Dutch have virtually eliminated the concept of ‘‘vulnerable road users’’ in that the risk of fatality for pedestrians, bicyclists and vehicle occupants has all converged at a low level. This is an amazing achievement, especially when compared with countries like the U.S. where the risk of fatality for non-vehicle occupants is 5–8 times that of vehicle occupants. In this paper, we assess the evolution of risk for different types of road users in the Netherlands since 1970. We also review critical events, advocacy, policies, and programs that were implemented in the Netherlands over the last five decades to address the issue of traffic safety. This analysis demonstrates that the Dutch used protests and advocacy campaigns to garner support for policies and programs that promoted non-motorized transportation as routine mobility choice. Furthermore, the governing body for safety in the Netherlands was an early adopter (in the 1990s) of a systems-based approach to traffic safety called Sustainable Safety. A 2020 FHWA webinar highlights that this systems-based approach is now beginning to take hold in the U.S.
- For safety sake: stop calling pedestrians and bikers vulnerable road usersGe Shi, Vannesa Methoxha, Carol Atkinson-Palombo, and Norman GarrickIn International Conference on Transport & Health 2021 - Virtual, Sep 2021
Background: Over the last decade or so the term ‘vulnerable road users’ has become de rigueur in the street safety community to highlight the heightened peril experienced by those road users not protected by being in a motor vehicle. Although this term has proven useful in elevating the awareness of the safety concerns of non-motorized users, it also has some drawbacks because it overlooks the systemic factors that put these users at higher risk in the first place. By focusing on the characteristics of the user we could limit the effectiveness of actions to improve safety for all users - while resulting in actions that stigmatize or blame those users. This tendency to blame the victim is seen in the over policing of pedestrians and bikers - a particular pernicious issue when it comes to people of color and raises serious questions of equity. Methods: This paper looks at the evolution since 1970 of police registered fatality per users for different classes of road users in the Netherlands, versus that in the USA. The numbers of road users are estimated by mode share data from the Dutch Travel Survey and the American Community Survey. We also looked at how the safety culture in the Netherlands has changed based on a concerted effort on the part of citizen advocates and government agencies to seek holistic solutions to improving safety. Results: We found that the patterns for rates of fatalities in the Netherlands in the 1970s were similar to those in the USA - pedestrian and bikes had a much higher rate of fatalities than did road users in vehicles. However, the patterns have diverged to such an extent that while the rates of fatalities in the Netherlands were converging to the same level for all three classes of road users we studied, the rates in the USA diverged, and today the rate of traffic deaths for pedestrians is an astounding eight times more than for car occupants. Conclusions: In the 1990s, these actions were codified as a transportation safety regime referred to as ‘sustainable safety’. At the conceptual heart of ‘sustainable safety’ is the idea that the whole traffic safety system should provide a reliable environment that caters to human behavior and shortcomings. In other words, this approach, focuses more on the vulnerabilities in the system as a whole and less on the vulnerability of individual users.


